With lock downs in place and boredom on the rise, people are looking to see what the next phase of life with COVID-19 is going to be. To lend some perspective to the ongoing discussions, I’m going to be dissecting the model of the Hammer and the Dance and comparing that to historic data from the 1918 flu outbreak.
Because SARS-CoV-2, the virus causing COVID-19 (named for the year it began infecting people), is capable of spreading in respiratory droplets it is able to spread far and wide. While the overall percentage of people who die once becoming sick with COVID-19 is averaging out at roughly 5%, the number of people hospitalized with the disease is 20-30%. New data from the CDC shows that the number is highly dependent on age and underlying conditions though there have been healthy young adults succumbing to the disease as well. Long message short, this is still a dangerous disease and everyone needs to be active about preventing spread.
Since COVID-19 spreads so well, with each person being able to infect at least 2 others, and some calculations are showing a R0 of up to 5, it is critically important to prevent the spread of this disease while we have yet to identify a treatment for it. By starving the virus of hosts, it will burn itself out. The Ohio Department of health has a video which is a great representation of why social distancing and isolation are able to stop the spread of the disease.
The severe restrictions in place are known as “The Hammer” in epidemiology. This is an efficient way to get a disease under control while treatments and vaccines are still being developed. For most of the world, we are in various stages of the hammer period.
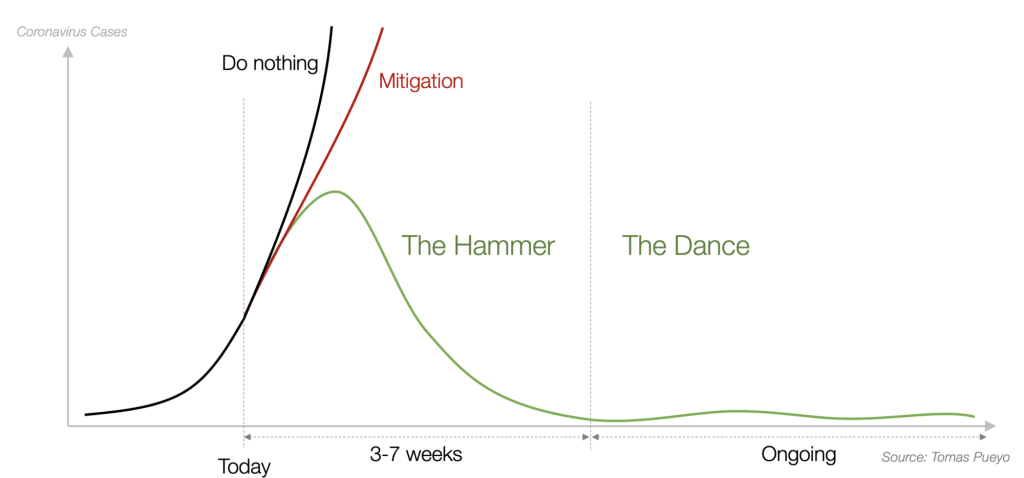
This period is allowing locations to slow the spread of the disease and minimize the total number of people sick at a time, known as the disease peak. Remember, we’re not just worried about deaths but about clogging up our hospital systems with patients who may need treatment for weeks at a time. The website covid19.healthdata.org/ has done a great job showing projected needs against the available number of resources. Below shows an image for Texas that shows a high availability of hospital and ICU beds, but a possible need for some ventilators in the state.

The website can also show the case load for a state or country and display the possible case load in the background against dotted line projections and solid line real figures.
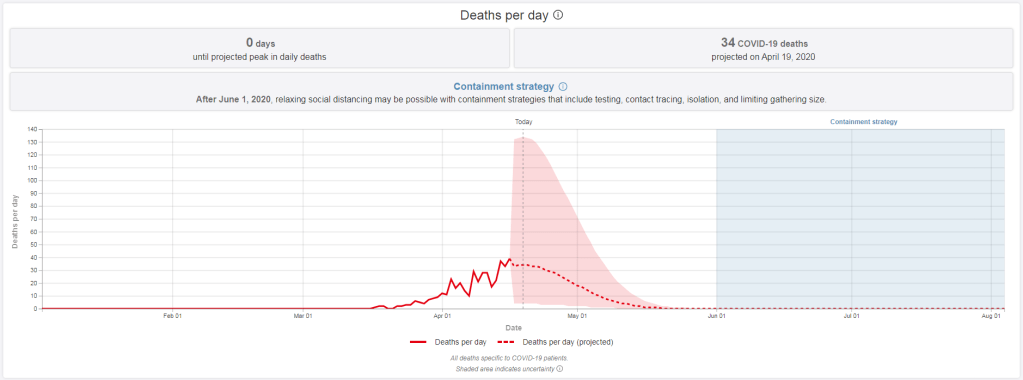
So now that we know we are peaking, the question is when do we begin to ease our restrictions? As you can see in the chart above, restrictions for Texas are currently recommended until June 1st before easing. These models are showing what happens when you just use the hammer (strict restrictions) until the disease is totally wiped out in a population. However the fact is there are a lot of people who won’t be able to last that long.
While there have been efforts from different governments to ease the personal effects of the economy totally shutting down, for a lot of people there hasn’t been enough relief. Because of this there is currently building pressure to remove all restrictions as soon as possible, which can cause us to go back to the original skyrocketing of cases.
Enter “The Dance”, part two of the first graphic referenced. The dance is a way to buy time without maintaining the hammer. When testing has become widespread we will be able to locate all cases of the virus we will be able to quarantine those who have had the virus or are possible asymptomatic carriers, allowing everyone else to lead closer to a normal life. During the dance we will still be unable to hold large events such as concerts and sporting events, but we should be able to go out shop, eat, and do more normal activities so long as social distancing and hand hygiene are properly maintained.
With this knowledge we are able to look back at the 1918 influenza pandemic and see how social distancing impacted the disease progression for different cities across the US. Thankfully this research has already been performed by Markel et. al in 2007 in a paper titled “Nonpharmaceutical Interventions Implemented by US Cities During the 1918-1919 Influenza Pandemic” in the Journal of the American Medical Association (JAMA). These researchers looked at 43 different cities in the United States and tracked their cases against how long the cities implemented social distancing strategies.
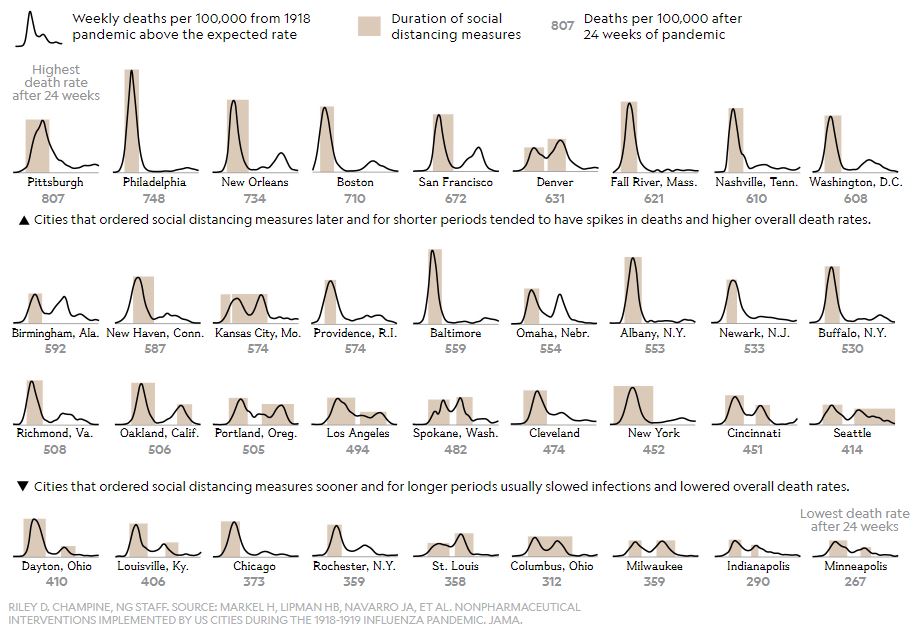
In this graphic the shaded areas represent the hammer. The main lesson we can learn from the past is that social distancing during the hammer period reduced the number of cases in every instance. Though what happened in Kansas City, Mo to cause the double peak with social distancing measures I have no idea, but the distancing did eventually work.
Some areas maintain a longer term hammer such and Philadelphia and Fall River. These cases have little to no cases later, which is ideal. However depending on what the cities had to do to enact such strong, long hammer periods it may not work for several areas. Businesses have to remain shuttered and that’s not something a lot of people can afford to maintain.
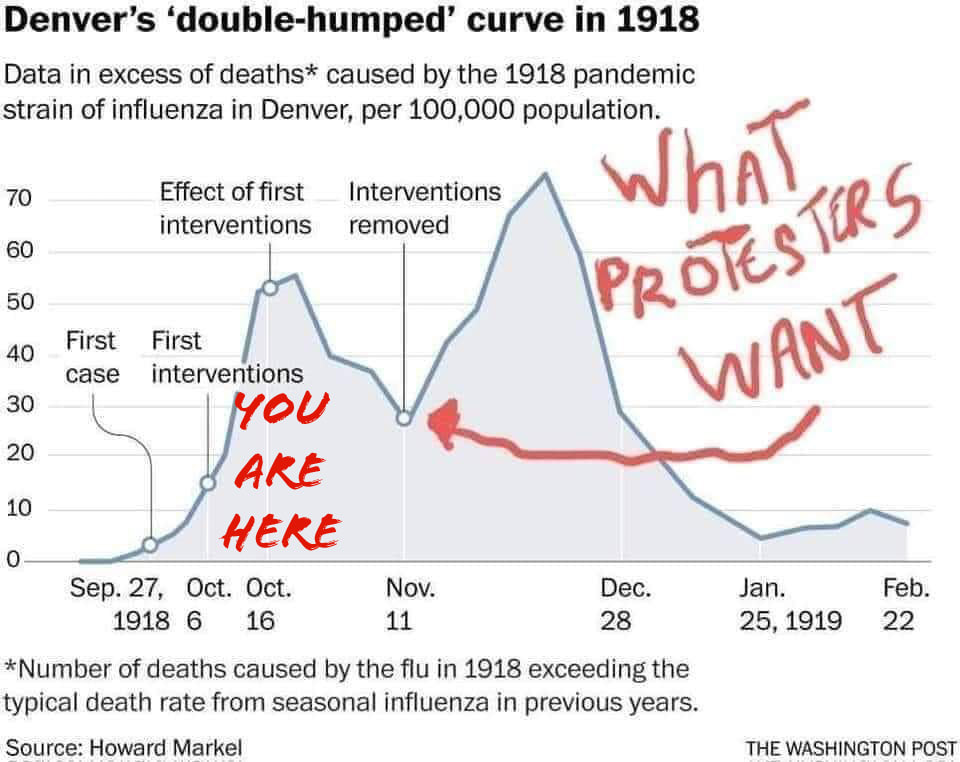
There are examples where areas see multiple peaks, some of which have multiple instances of implementing the hammer, such as Denver. These are examples of easing restrictions too soon, leading to multiple hammers necessary before the disease is beaten. If restrictions are removed prematurely, it allows for the disease to rebound and cause the disease to continue spreading. The second peak can have even more deaths than the first because people may not recognize the need for continued vigilance, allowing the disease to spread even broader than in the first wave.
The final examples are areas such as Nashville and Washington D.C. where there is a period of hammer, followed by some cases but nothing amounting to a second full peak. The following period is the dance, where restrictions are lightened and quarantine is kept at an individual level rather than for the entire population of an area.
While no economic data is presented in the paper, we can look at our current curves and the level of restrictions in place. There are a lot of options on how we react, and every area needs to have its own tolerance. Based on the historic models and our current situation, it appears that many parts of the US will be enacting hammers and dances or having multiple series of hammers.
The long and short of it is that keeping COVID-19 at bay is a personal responsibility and we have to all do our part to properly conquer this disease. Even as restrictions ease if we still minimize going out, wear masks while in public, and continually wash our hands we have the best chance of returning to normal sooner rather than later with minimal risk in resurgence.
So continue staying home and staying safe,
-Colleen

One thought on “Collateral Science – The Hammer and The Dance”